✔ One of the highest interest rates for savings accounts
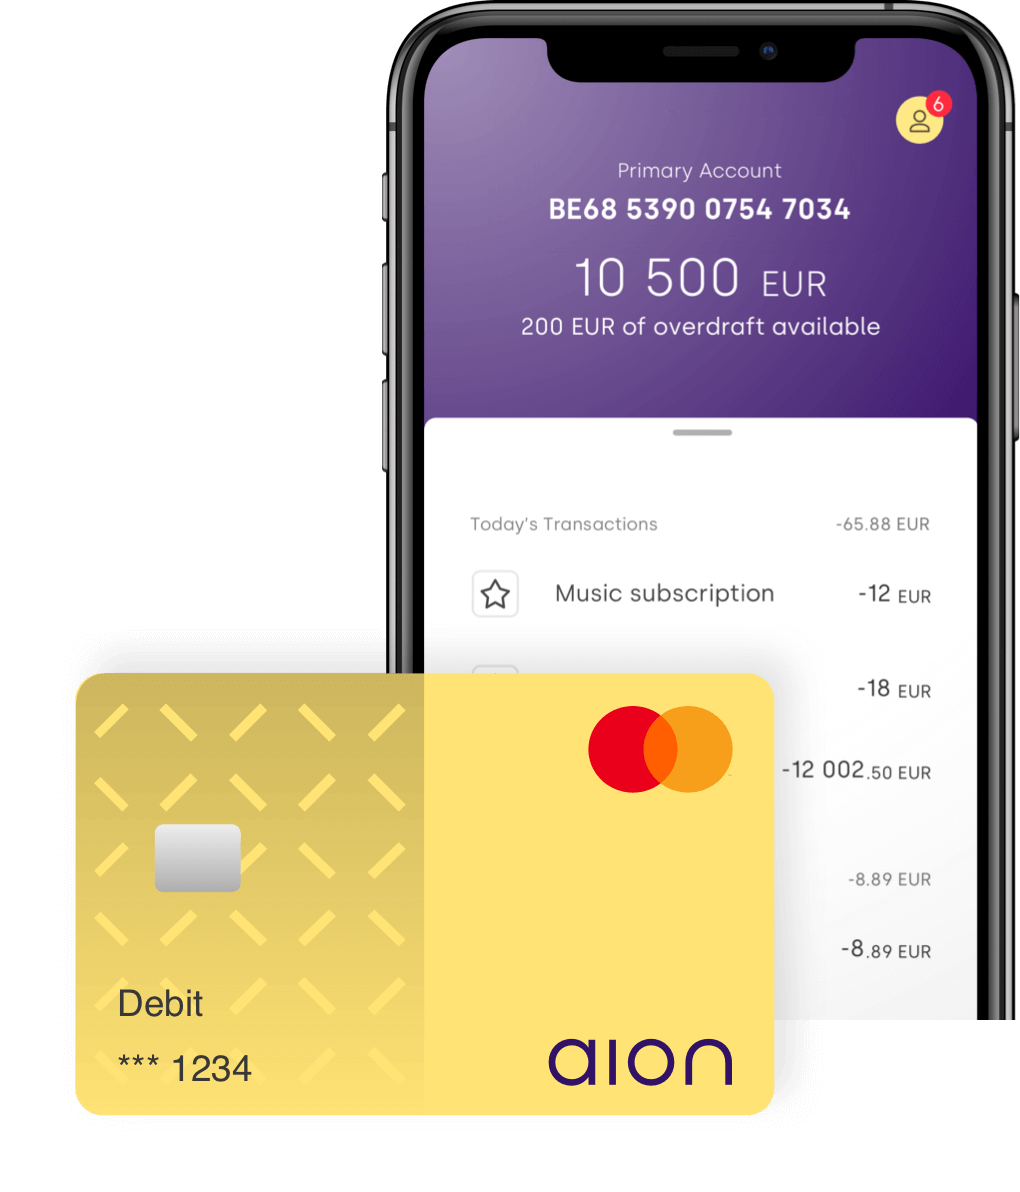
✔ Fully digital banking made easy
✔ One monthly fee
Immediate access to our exclusive products
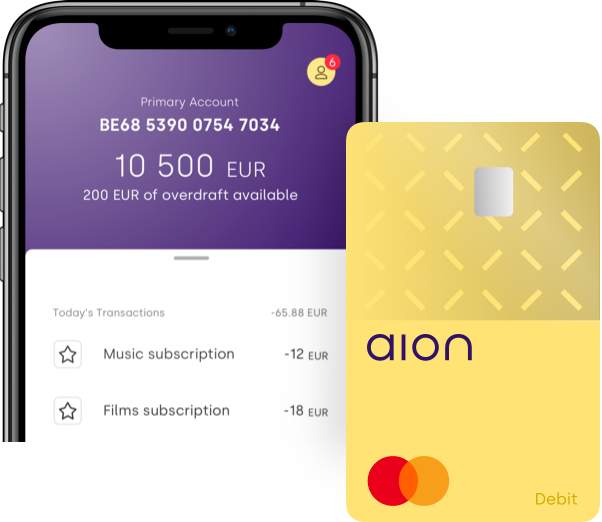
✔ Start right away: all you need is a smartphone.
✔ You can stay with your home bank and use our products to turbo-boost your finances.
✔ You can stay with your home bank and use our products to turbo-boost your finances.
Watch video (00:14)
Fully digital banking made easy
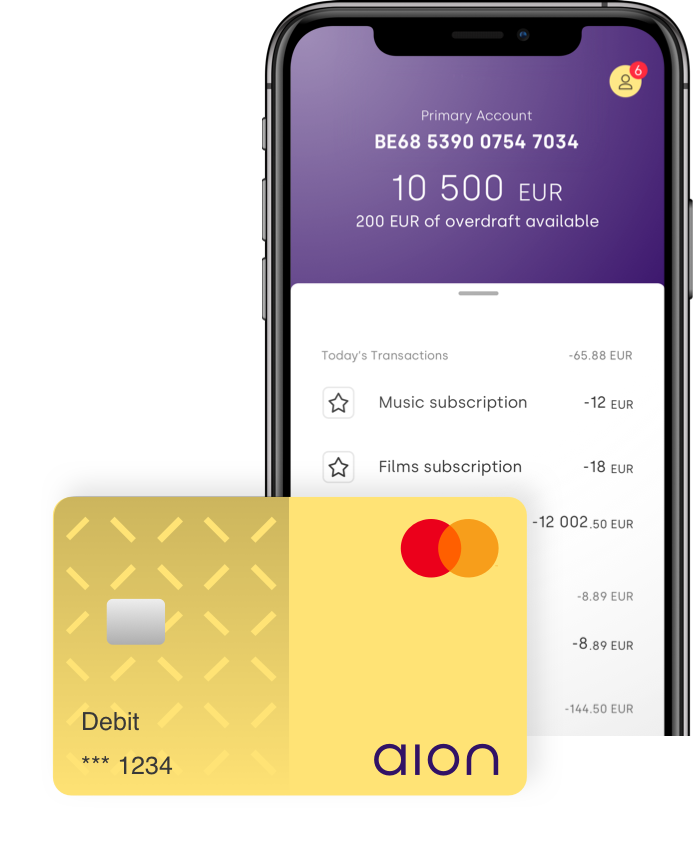
✔ You are in control: access your finances whenever and wherever you want.
✔ 100% of services can be started via our app.
✔ Say goodbye to branch visits and card readers.
✔ 100% of services can be started via our app.
✔ Say goodbye to branch visits and card readers.
Watch video (00:27)
“The Netflix of Banking”

“An entirely transparent model that will change the way you bank”
